SQL Explorer
With Logfire, you can use the Explore page to run arbitrary SQL queries against your trace and metric data to analyze and investigate your system.
Querying Traces
The primary table you will query is the records table, which contains all the spans/logs from your traced requests.
To query the records, simply start your query with SELECT ... FROM records and add a WHERE clause to filter the
spans you want.
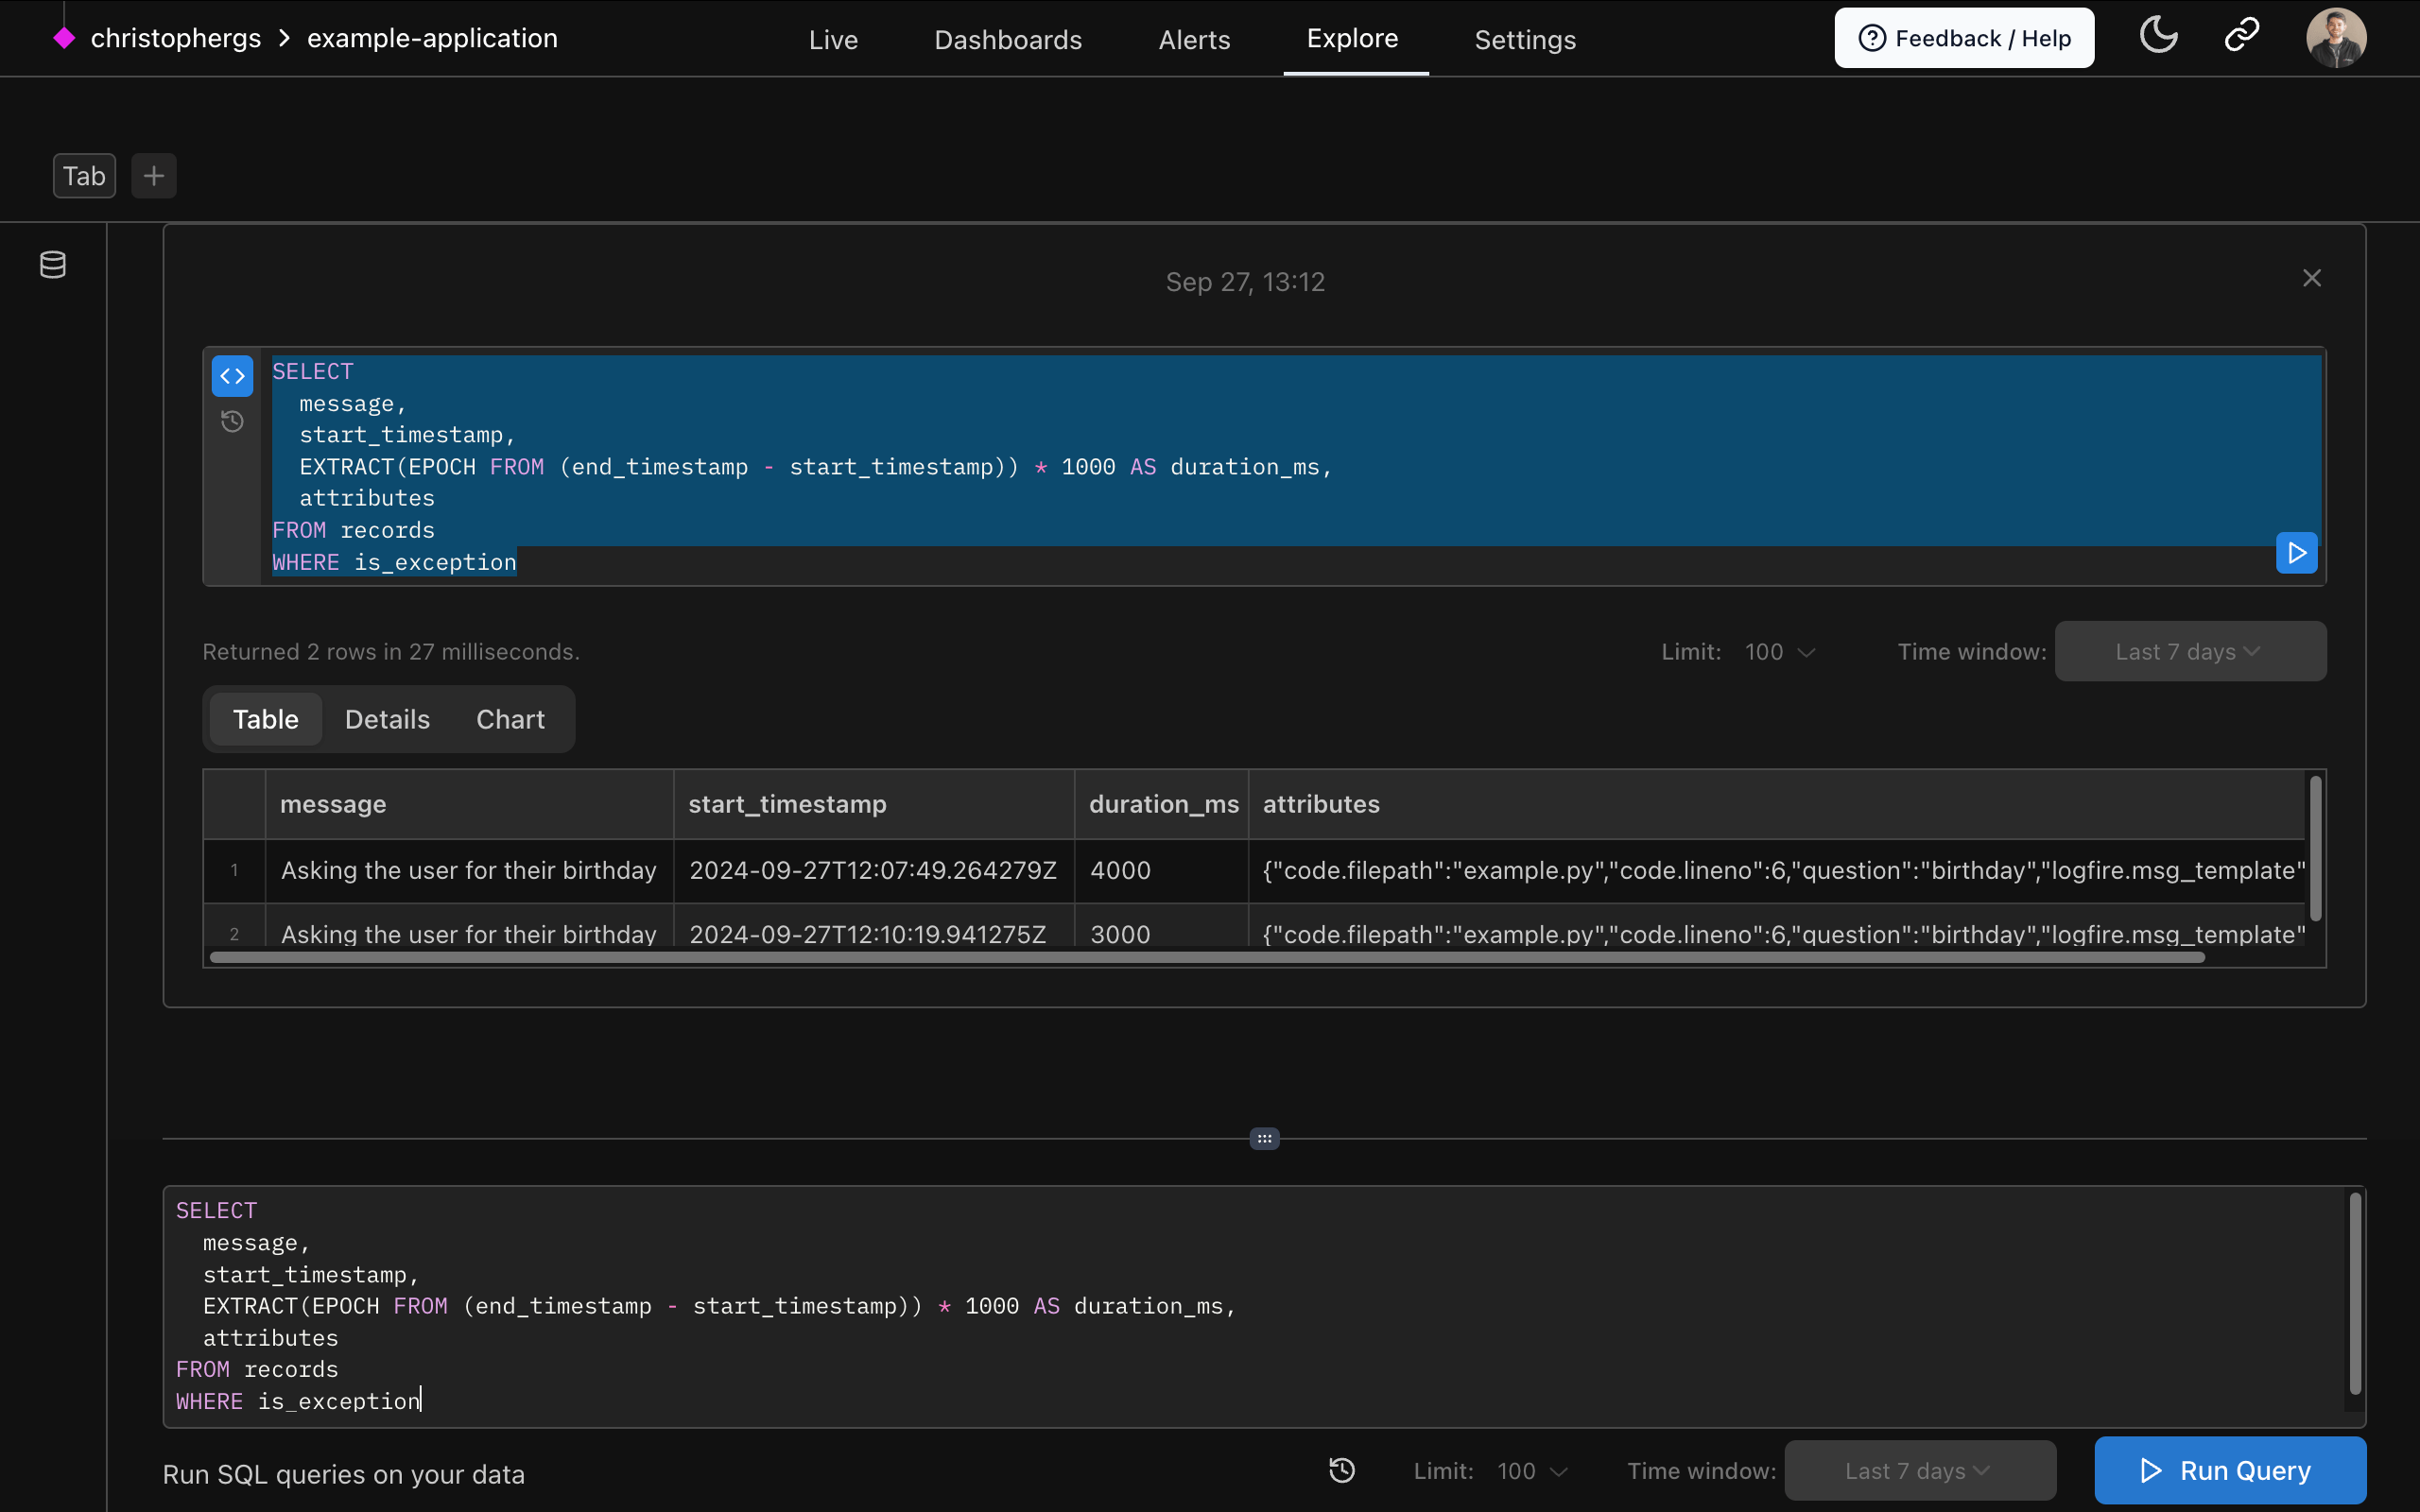
For example, here is a query that returns the message, start_timestamp, duration, and attributes for all spans that have exceptions:
SELECT
  message,
  start_timestamp,
  duration * 1000 AS duration_ms,
  attributes
FROM records
WHERE is_exception
You can run more complex queries as well, using subqueries, CTEs, joins, aggregations, custom expressions, and any other standard SQL.
See the SQL Reference for details on the SQL syntax supported by Logfire as well as the tables and their columns.
Cross-linking with Live View
After running a query, you can take any trace_id and/or span_id and use it to look up data shown as traces
in the Live View.
Simply go to the Live View and enter a query like:
trace_id = '7bda3ddf6e6d4a0c8386093209eb0bfc' -- replace with a real trace_id of your own
This will show all the spans with that specific trace ID.
Metrics Schema
In addition to traces, you can also query your metrics data using the metrics table.
The schema of the metrics table is:
CREATE TABLE metrics AS (
    recorded_timestamp timestamp with time zone,
    metric_name text,
    metric_type text,
    unit text,
    start_timestamp timestamp with time zone,
    aggregation_temporality public.aggregation_temporality,
    is_monotonic boolean,
    metric_description text,
    scalar_value double precision,
    histogram_min double precision,
    histogram_max double precision,
    histogram_count integer,
    histogram_sum double precision,
    exp_histogram_scale integer,
    exp_histogram_zero_count integer,
    exp_histogram_zero_threshold double precision,
    exp_histogram_positive_bucket_counts integer[],
    exp_histogram_positive_bucket_counts_offset integer,
    exp_histogram_negative_bucket_counts integer[],
    exp_histogram_negative_bucket_counts_offset integer,
    histogram_bucket_counts integer[],
    histogram_explicit_bounds double precision[],
    attributes jsonb,
    otel_scope_name text,
    otel_scope_version text,
    otel_scope_attributes jsonb,
    service_namespace text,
    service_name text,
    service_version text,
    service_instance_id text,
    process_pid integer
)
You can query metrics using standard SQL, just like traces. For example:
SELECT *
FROM metrics
WHERE metric_name = 'system.cpu.time'
  AND recorded_timestamp > now() - interval '1 hour'
Executing Queries
To execute a query, type or paste it into the query editor and click the "Run Query" button.
You can modify the time range of the query using the dropdown next to the button. There is also a "Limit" dropdown that controls the maximum number of result rows returned.
The Explore page provides a flexible interface to query your traces and metrics using standard SQL.
Happy querying!


